Incinerator operators are heavily incentivised to prove the calculation of the fraction of biogenic CO2 emissions.
There is currently a transition from fossil-based materials to products based on renewable materials. This transition has led to a need to control the proportion of the biogenic material that comes from renewable sources.
Why Measure Biogenic CO2?
The measurement of biogenic carbons have come into focus because of the world attention on net-zero targets offsetting emissions. The increase of greenhouse gas (GHGs) emissions is impacted by the fuels combusted in Energy from Waste sites. Fuels release huge amounts of carbon dioxide (CO2) emissions into the Earth’s atmosphere. CO2 made up of biogenic and non-biogenic carbon. It is among the leading factors which have been shown to contribute to global warming, therefore, enhances climate change and alters the natural carbon cycle.
To be able to report biogenic CO2, operators must understand how to measure it.
What’s the Difference Between Biogenic and Non-Biogenic CO2?
The current net increase of atmospheric CO2 is mainly due to the combustion of fossil fuels (non-biogenic carbon) because its carbon was not part of the Earth’s carbon cycle before it was combusted.
On the other hand, biomass carbon (biogenic carbon) is part of the natural carbon cycle. The combustion of biomass material (including forest-derived and agriculture-derived feedstocks) does therefore not result in a significant net increase of atmospheric CO2 if new biomass is grown again.
Biogenic carbon offers significant advantages over non-biogenic carbon. Using biomass as a fuel helps maintain a constant level of carbon in the environment. Its emissions remain part of the biogenic carbon cycle. Therefore, biogenic CO2 plays an important role in balancing Earth’s natural carbon cycle.
By differentiating between biogenic and non-biogenic-CO2, operators can effectively quantify GHGs, and the credits needed to offset carbon footprint. By reporting lower emissions with confidence, operators can also potentially capitalise on surplus allowances for trading under the Emissions Trading Scheme.
Applications
There is a requirement to monitor biogenic CO2 in any applications in which biomass emissions need monitoring for regulatory reporting and GHG inventory including:
- > Energy from Waste
- > Electricity generation (biomass or mixed fuels)
- > Coal co-firing (mixed fuels)
- > Cement and lime production
How is Biogenic CO2 Measured?
There has been an increasing interest for the quantification of biogenic CO2 in emissions.
When combusting mixtures of fuels which originate from fossil fuels (including plastics and textiles combusted in EfW plants), and biogenic (food waste or organic origin), current technology prohibits the exact ratio of biogenic and fossil CO2 in the total CO2 that is emitted through the stack gas.
Until now, accurately measuring the Biogenic fractions has not been easy.
14Carbon Dating
The Carbon-14 method (14C) using radiocarbon dating. It is very reliable and sensitive for industrial plants to verify data estimations of biogenic fractions of CO2 emissions.
When the two fuels are burned together, an accurate breakdown of the biogenic CO2 fraction of the emissions can be achieved using the process of 14Carbon dating.
Since fossil fuels do not have any carbon-14 isotopes, the 14C method provides the most accurate and cost-effective way for quantifying biogenic CO2 emissions.
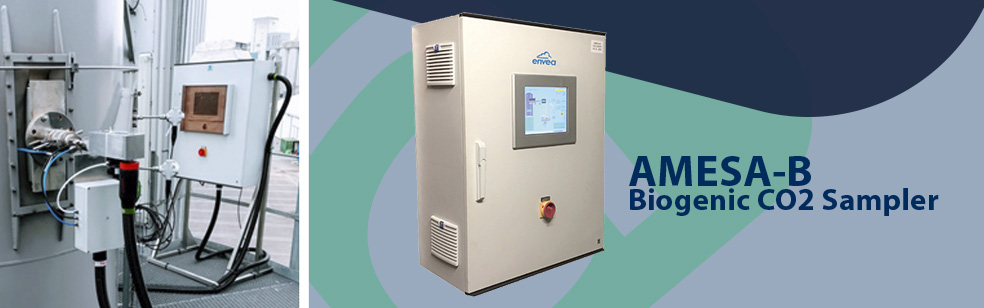
AMESA-B Sampler
a1-cbiss supply the AMESA-B, a fast, and reliable automated extractive sampler which follows the EN ISO 13833 standard. Therefore, it determines the biogenic and fossil fraction of industrial CO2 emissions.
The automated sampler extracts CO2 samples from exhaust gas in the flue via a heated sampling probe. An absorber cartridge filled with sodium hydroxide or soda lime determines the biogenic fraction of CO2 emissions.
- > Enables sites to claim ROCs for reporting biogenic fractions
- > The sampling principle fulfils the requirements of EN ISO 13833
- > Sampling period from 1 hour to 1 month
- > Instalment pending on 5 Energy from Waste sites
A Huge Return On Investment
Based on our example below, you can quickly see understand how a sound ROI can be achieved.
The Renewable Obligation Certificates (ROCs) scheme, regulated by Ofgem requires licensed electricity generators to source a proportion of the electricity from renewable sources.
Once a generator intends to determine the renewable energy content, in order to obtain ROC’s, 14C testing proves biogenic content is at 50% or greater.
How are ROCs Calculated?
If an energy generator produces 100% biogenic content (wood chips, wood pellets, and grass pellets) they would qualify for 1 of a ROC for every MWh generated. However, incineration or co-generation sites would expect to achieve a lower percentage.
| Reported % Biogenic Content | Value per ROC* Correct in August 2022 |
| 100% | £50.80 |
| 90% | £45.72 |
| 80% | £40.64 |
| 70% | £35.56 |
| 60% | £30.48 |
| 54% | £27.43 |
| 50% | £25.40 |
| Value per ROC | Hours of Generation | MWh Output | Daily Total | Monthly Total (30 days) |
| Eg. £27.43 | 24 | 25 | = £16,458 | = £493,740 |
| £25.40 | 24 | 25 | = £15,240 | = £457,200 |
An incineration plant with an output of 25 MWh, reporting biogenic content at 50% and operates for 24 hours a day, could generate over £450,000 worth of ROCs per month.
Now the interesting part.
For every 1% of biogenic content that the same plant, operating in the same way can prove, site will generate an extra £9000 worth of ROCs per month.
For more information about our Biogenic CO2 emissions monitoring system solution, contact us today.